Diets and food habits may vary widely from country to country in terms of ingredients and cooking techniques. Nevertheless, dishes from different regions may share similarities in flavours and tastes. In this article, we explore these similarities and differences using Yummly, a platform mainly used in North America containing recipes from different countries.
Exploring cuisines with Yummly
Yummly provides recipes along with their ingredients and nutritional intake data. We counted 19 unique cuisines in total ranging from the sweetest to the spiciest. Each cuisine counts a number of recipes ranging from 200 to 200K. We are also provided with the flavors defining each recipe and their respective preparation time.
Let’s dive into data!
Ingredients
Our dataset contains recipes representing different countries around the world, implying that we have a large variety of ingredients (~5K). However, a small subset of the ingredients is commonly present across all cuisines (e.g. salt, olive oil..).
Most used ingredients in the world
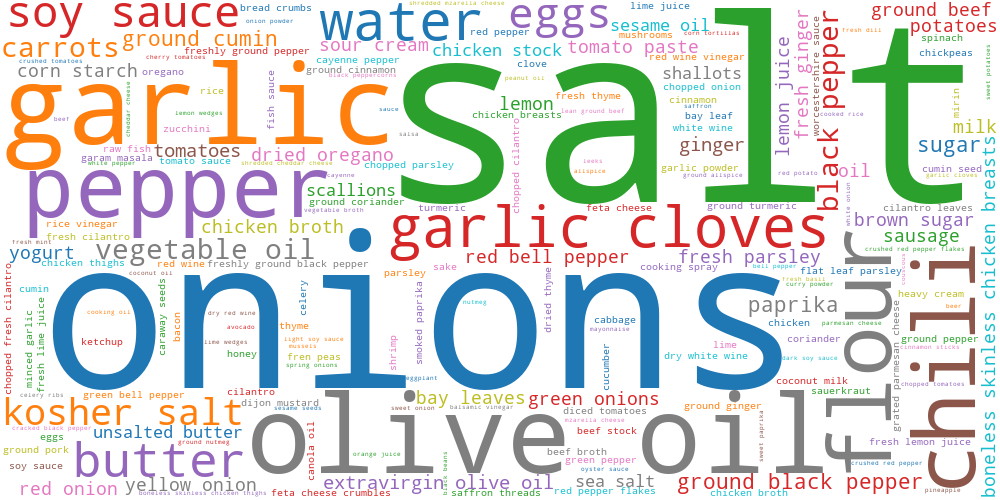
As expected, spices like salt/pepper is very common across all cuisines. Our curiosity leads us to explore them by characteirizing each with its distinctive ingredients.
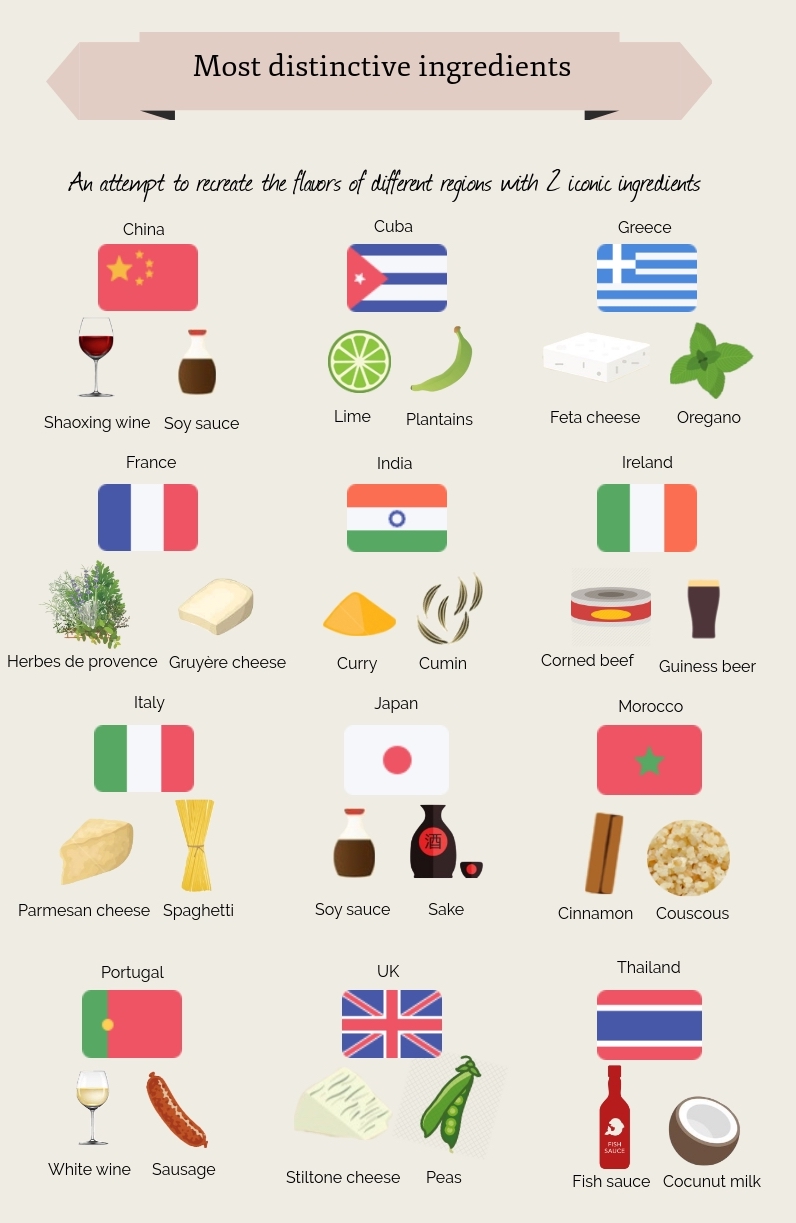
While it’s hardly fair to stereotype an entire national cuisine with a few basic ingredients, it is hard to deny some flavours evoke dishes from certain parts of the world. Indeed, it is not unknown for countries to almost be defined by their “iconic dishes”. Here is what data says:
Fun fact: Is American cuisine just about burgers?
According to Yummly, less than 7% of american recipes are about burgers. Also, none of the most distinctive ingredients of the US is used to prepare it. Thus, Americans eating mostly burgers remains just a stereotype.
Although distinctive ingredients distinguish well enough a cuisine, we often think of a gastronomy as a combination of flavours. As flavours originate from a mix of specific ingredients, one may look for distinctive combination of ingredients for each cuisine:
The bove network was based on the frequency of pairwise combinations of ingredients using their respective frequencies.
In many cuisines, ingredients orbit around a central ingredient: Fish sauce for Thai food, Enchilada Sauce for Mexican or Gram masala for Indian. Moreover, Asian cuisines like Chinese and Japanese share many ingredients as Italian and French do.
Similarities between cuisines
It is true that cuisines have different distinctive ingredients, nevertheless, similarities between their recipes is not to neglect as can be seen below:
Clustering recipes was reduced to a dimensionality reduction problem which is then solved with t-SNE algorithm.
Here again, it is clear that recipes from different cuisines do not always share the same ingredients (e.g. Spanish and Japanese), However, as the English and Irish clusters overlap, one may conclude that there is an influence of one on the other. One possible reason of this similarity might be the geographic proximity of both countries, or also to the shared history between the two cultures.
One way to further analyse similarities between cuisines is to explore the confusion between recipes of different cuisines. For this purpose, we train a simple machine learning model (logistic regression) and examine its confusion matrix.
Similarities between cuisines
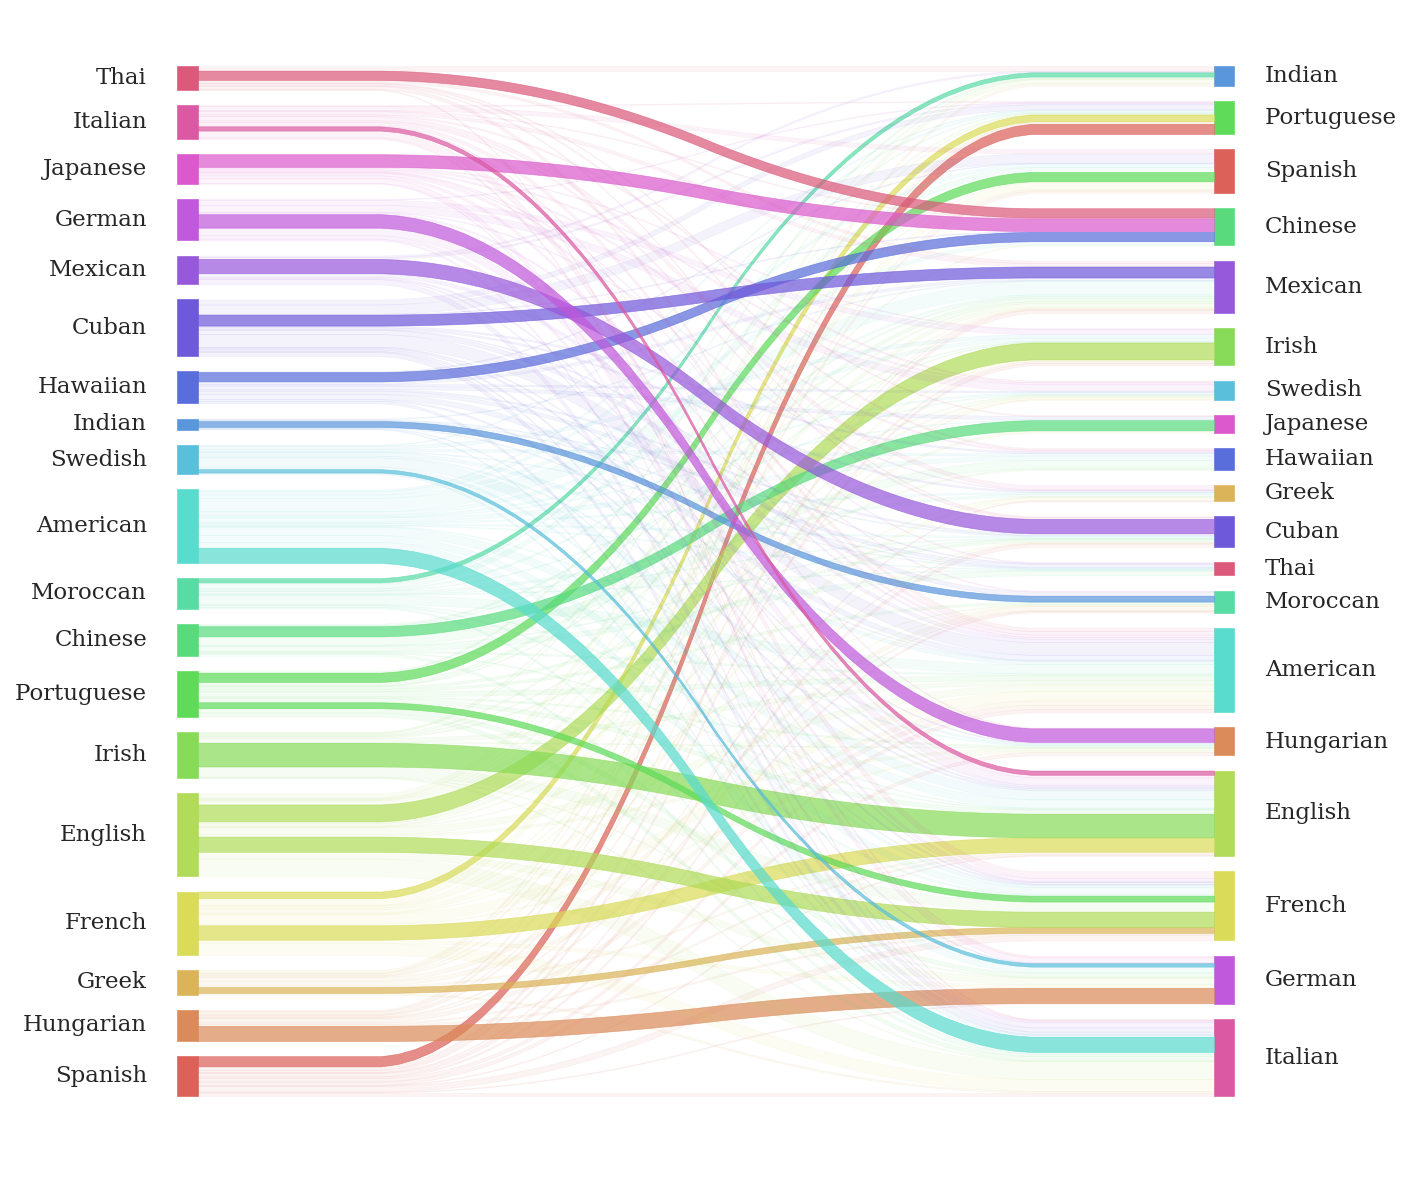
As expected, we observe similar results, with :
- Spanish and Portuguese
- Irish and English
- Mexican and Cuban
- Chinese and Japanese
- Thai and Chinese
showing strong similarities as they are often confused by our model. Thus, The latter results support our two hypotheses stating that closer countries will share more similarities.
Meat’O’Meter
Across several cuisines, meat is a major component of recipes. Its consumption varies depending on cultural or religious orientations, as well as economic conditions. Therefore, exploring meat preferences across cuisines would give us an idea about a region’s food habit. To do so, we analyse the usage of different types of meat across cuisines:
Select a meat and see who are its big consumers
From plotting various meat types, we see different distributions with the following being noticeable:
- Indian and Mexican cuisines use poultry much more than red meats.
- Asian, more specificcaly Japanese recipes contain more seafood compared to other cuisines.
Interestingly, some cuisines do not have recipes containing some types of meat. The results can be explained by the the fact that cuisines mostly use ressources available in their specific region (e.g. tuna and salmon in Japan). Another reason is culture and believes, some countries have specific religions or practices forbidding eating certain types of meats (e.g. beef in India - pork and bacon Morocco)
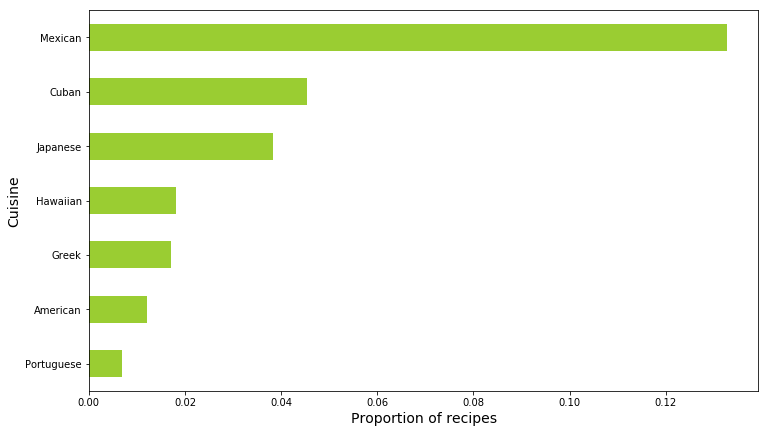
Fun fact: Who is Avocado’s biggest fan?
Over the last decade, worldwide comsumption of avocado has tripled showing a high interest in this fruit. Let’s find out from our data what cuisine use it the most:
Avocado appearance in recipes
Cooking Time
Another interesting variable to study is their corresponding preparation time which may differ depending on the techniques involved in the cooking process (frying, roasting, steaming etc…) or also the types of ingredients. We aggregate the cooking time of recipes by cuisine and plot their respective cumulative distributions:
Cooking time in cuisines
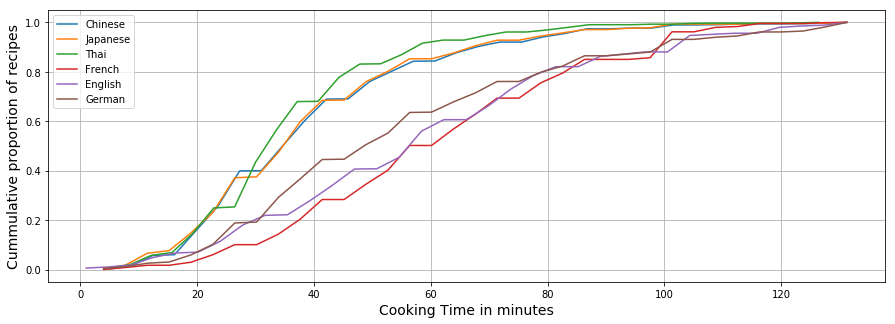
The distribution of the Asian cuisines (Chinese, Japanese and Thai) are quite similar and different from the European cuisines(English, French and German). We also note that Asian recipes are less time demanding compared to the European ones. This can be explained by the eating habits of Asia in which meals are composed of many small dishes (recipes) each taking less time than cooking a one-dish meal.
Recipe recommender
As we have now analysed resemblance between cuisines and their ingredients, we build a recipe recommender that suggest similar recipes using the cosine similarity metric. For each result, a score will define the similarity degree of its ingredients with the selected recipe.
Select a recipe and get suggestions
As recipes don’t match exactly in terms of ingredients, they will have a low similarity degree even though the images look alike.
Summary
From this project, we answered various questions by analysing our dataset. Indeed, we establish similarities between cuisines, their mutual influences and finally characterized each with a set of distinctive components. To do so, we needed to carefully explore and clean the data during which we faced challenges such as correcting the ingredients names and dealing with duplicate values. Besides, we explored various techniques, some of which revealed good results and led to meaningful insights.
Methodology notes: In this section, we go through the methodology used to build different components of our analysis.
-
t-SNE: To create our recipe cluster, we used a dimensionality reduction technique called t-distributed Stochastic Neighbor Embedding. Our input is the one-hot vectors of 5000 dimensions. The output of the t-SNE algorithm mapped recipes to a two-dimensional space based on the similarity (cosine-similarity) of their ingredients.
-
Cosine similarity: Cosine similarity is a common way of calculating the similarity between two vectors by taking the cosine of the angle between them. In our case, that means taking the one hot encoding vector of a recipe and comparing it to that of another. Higher cosine values imply more similarity, with an upper bound of 1 when the vectors are perfectly similar.
For more details concerning the implementation of our analysis, please refer to the github repository associated with the project. More details are provided within the Jupyter Notebook.